

During the last decades, ecosystems have suffered a decline in natural resources due to climate change and anthropogenic pressure. This work proposes a methodological framework to monitor the changes produced in this protected area using multi-source remote sensing imagery.
Ecosystems are exposed to high pressure due to intensification of agricultural land use, tourism, development, and climate change, being highly dynamic in space and time. Specifically, climate change is producing important variations in entire communities in those areas where it manifests most intensely, such as regions at greater latitude and areas of higher altitude. Thus, ecosystem deterioration has a strong negative impact in the local biodiversity and might put rare and threatened species at a serious extinction risk.
An ecological monitoring program should ideally consider ecological relevance, statistical credibility, cost-effectiveness, flexibility, and transferability to other systems, as the most important criteria. In this context, remote sensing could be an important tool to monitor ecosystems, at community and species level to detect population trends, that guide in the establishment of conservation objectives with the purpose of avoiding the transition to undesirable situations.
Remote sensing can contribute to a better understanding of natural habitats, their spatial distribution, and their conservation status, being considered an ideal data source for land-cover classifications in large areas. Hence, it is a valuable tool for monitoring and managing ecosystems, as it allows the acquisition of data in remote and inaccessible areas. Besides, it has been successfully used for many ecological studies, such as detecting land-cover changes, monitoring crops, deforestation, forest fires, estimating carbon sequestration, detecting vegetation stress, and other applications. This technology is important since traditional field-based assessment methods are sometimes subjective, time-consuming, data lagged, and often too expensive.
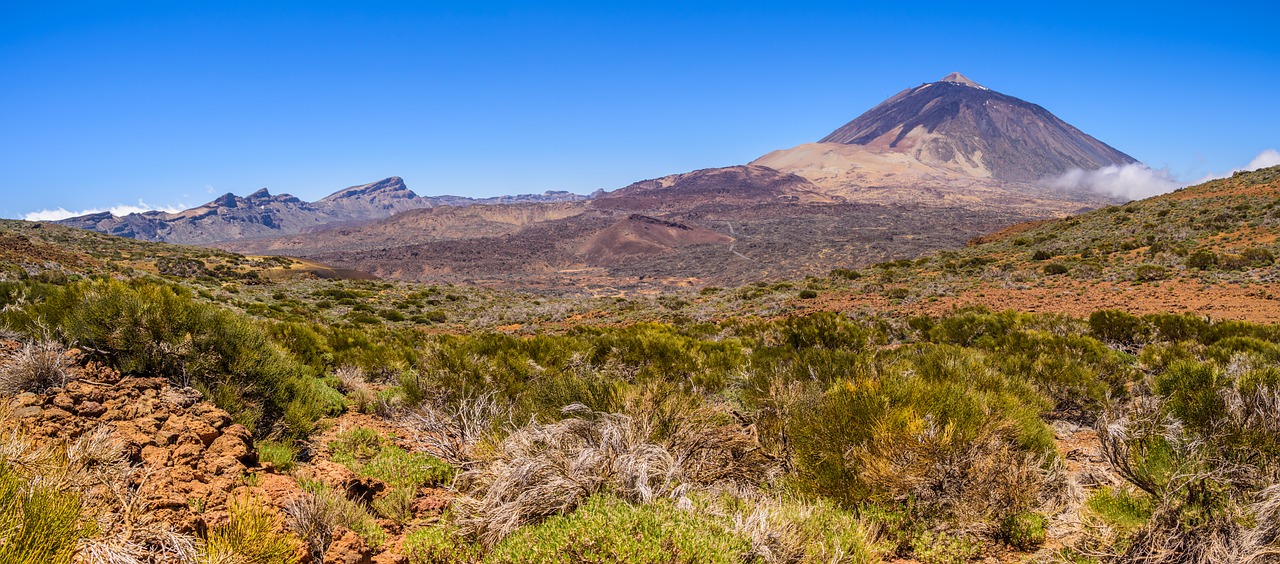
Thus, remote can complement and add information to traditional field-based methods providing indicators for different spatial and temporal scales and involving varying temporal revisit frequencies up to daily observations. The area of study is the Teide National Park (Tenerife, Spain), a vulnerable high mountain ecosystem strongly stressed by climate change. This study describes a methodology framework to monitor non-herbaceous species of these ecosystems using remote sensing imagery. The conservation managers have analyzed how the two keystone species have changed their population dynamic due to the abundance of European rabbits and recurrent drought episodes. Specifically, the study proposes a post-classification analysis to study those dynamics by using remote sensing multi-source and multi-temporal data, in order to complement and add accurate information to the field observations, for a future ecosystem management.
Ecosystem description and problematic
The Teide National Park has been historically the object of several human uses, mainly led by the grazing of goats and the extractive activities of soil and wood of S. supranubius. Nowadays, goats have been eradicated, while extraction of wood is considered a traditional activity of low intensity, being beekeeping the only remaining activity. The greatest current challenges for the management of the Park are public use, herbivory pressure due to rabbits and droughts episodes, and temperature increase (climate change). Regarding public use, it is about making compatible the enjoyment of nature, by more than four million visitors a year, with its conservation. The presence of herbivores continues to be a factor of pressure on the flora, especially the European rabbit (Oryctolagus cuniculus). The rabbits were introduced on Canary Islands during 15th–16th centuries by the Castilian conquerors, but their populations have increased in the last decades, reaching densities of up to 3 rabbits/ha some years, because the climate in the summit is becoming less cold. They play a key role in the functioning of the ecological systems. Oryctolagus affects ecosystems by producing changes in the structure and composition of the soil, as well as in the richness and diversity of plant species.
Spartocytisus supranubius is the key species of the high mountain ecosystem of Tenerife. Its populations were reduced at the beginning of the last century until the declaration of the Teide National Park led to the suppression of pastoral activities in the sixties. Since then, their populations experienced a considerable recovery; however, this positive trend slowed down in the 1980s, when episodes of death began to appear matching with a strong increase in temperature, drought episodes, and, probably, an increase in rabbit populations. Extinction events of S. supranubius affect the entire National Park but are most notable in the southern area where extreme drought severely reduced the secondary growth of brooms. The dendrochronological analyses, elaborated by Olano et al. (2017), studied the impact of the droughts of 2008 and 2012, underlining that they were important stress factors behind the death of S. supranubius. Remote sensing can complement and add relevant information to Cubas et al. (2018) work, covering a larger area of study and quantifying the surface area of the same species considered in this study, as well as other important species of the Teide National Park.
Pre-processing
Prior to a land-cover change analysis, some preprocessing steps are necessary to standardize the multi-source and multi-temporal images. Remote sensors provide raw data images; thus, it is necessary to apply correction techniques and to perform image pre-processing in order to obtain high-quality imagery. Radiometric and atmospheric correction.—Apart from the radiometric calibration to convert digital numbers to radiance values, there are different ways of correcting remote sensing data for atmospheric effects: simple image-based methods and more complex algorithms based on a radiative transfer model of the atmosphere. In this work, complex models were applied: specifically, the fast line-of-sight atmospheric analysis of spectral hypercubes (FLAASH) to the satellite data and the atmospheric correction (ATCOR-4) to the airborne imagery.
Once the pre-processing steps were completed, images with different spectral bands at 50 cm of spatial resolution providing reflectance values of the Earth surface were obtained. The next step was to create a mask to eliminate non-vegetation pixels. The reflectance curves (spectral signatures) for the different wavelengths of healthy green plants have a characteristic shape that is dictated by various plant attributes . Due to the characteristic vegetation spectral signature, vegetation indices are common to enhance vegetation information. The normalized difference vegetation index (NDVI) and the modified soil-adjusted vegetation index (MSAVI2) are the most suitable for estimating quantitative characteristics of vegetation in dry and semi-dry regions. NDVI is the ratio between the Red (RED) and the near-infrared (NIR) regions, while MSAVI2 is a more complex index applied to areas with a high degree of exposed soil surface
Classification results
It is important to highlight the difficulty in classifying some types of vegetation due to the complexity of this heterogeneous shrubland ecosystem with mixed and small vegetation species such as D. bourgaeana. Hence, the major impact on the mapping of different types of vegetation is the misclassification created within the plant species, due to their spectral similarity and the mixing contributions from different covers in some pixels. Thus, it is important to create a reliable training sample database, which allows an accurate supervised classification to be made. This assumption leads us back to the importance of obtaining a fused image with the maximum spatial quality that allows to differentiate some small size species from others, avoiding pixel misclassification but also preserving the original spectral information. A visual inspection of each classification was carried out to identify areas of potential error contrast between classifications. Moreover, the results of the classification were quantitatively assessed using the confusion matrices and the overall accuracy and kappa coefficient. It shows the SVM classification overall accuracy and the kappa coefficient. It can be observed that accuracy increases depending on the type of imagery, being CASI imagery the most suitable sensor to obtain accurate thematic map, followed by WV-2 imagery. The main reason is the higher available number of spectral bands for the classification presents the thematic maps for each scene. The increase in S. supranubius in 2015, followed by a decrease in 2017, was visually observed. Pterocephalus lasiospermus increases its coverage area from 2002 to 2017. D. bourgaeana seems to suffer a reduction of its cover area too, while Pinus canariensis remains stable.
Discussion
A complex ecosystem, with mixed vegetation and small size, was analyzed using remote sensing data, being a challenging methodological framework. Specifically, it was observed the necessity to perform accurate pre-processing steps in order to improve the spectral and spatial quality of the imagery. Vegetation indices were also applied to improve the final mapping accuracy. After performing the specific pre-processing steps, it was possible to obtain quite reliable thematic maps applying the SVM algorithm, properly trained and parameterized, which were used for the change detection study. Multi-source and multi-temporal remote sensing imagery were used to complement and add accurate information to field observations for a future ecosystem management. Important outcomes of the study are the increase in the coverage of vegetation (practically doubled) in 15 yr, the dominance of Pterocephalus lasiospermus whose extension has almost tripled, and the decline of S. supranubius (despite the rebound of 2011), corroborating the works by Olano et al. (2017) and Cubas et al. (2018), for specific test locations. It surprises the rapid expansion of P. lasiospermus, a very rare species several decades ago, whose current predominance is accelerated vigorously, altering the landscape in this sector of the high mountain ecosystem. Undoubtedly, the aforementioned facilitating effect of herbivores, their better resistance to herbivory, and their own thermophilic character are factors that help explaining their considerable increase in a warming scenario. Thanks to remote sensing, it has been possible to study those changes in a larger area, as well as obtaining quantitative results of how the species coverage and location have changed during years. However, some advanced tasks have to be undertaken before satisfactory results can be achieved (i.e., suitable data, pre-processing, develop accurate classification models, knowledge of the study area, and time and cost restrictions). In conclusion, the remote sensing framework proposed is ecologically relevant, statistically credible, cost-effective, flexible, and transferable to other systems giving a guidance to environmental managers to consider remote sensing as a useful tool. Moreover, hints and advices are given to facilitate the framework application to other habitats and ecosystems. Future studies will include the systematic change detection monitoring in the whole Teide National Park, using WorldView-2 and WorldView-3 imagery, in order to obtain more accurate results and with a continuity during years. Moreover, vegetation features, habitat heterogeneity, species richness, and species–area relationships can be extracted from this study. Thus, specific research plans could be implemented following the proposed framework.
